I will show you tools that are freely available to find such stocks.
What is Intraday Trading and what should you consider before taking a trade in them?
Intraday trading means buying and selling stocks within the same trading day. To select stocks for intraday trading, you need to follow some basic steps:
Step by Step Guide for finding stocks for intraday trading
Identify the trend of the Index
There are 2 ways to identify the trend of the index based on the PCR( Put Call Ratio or Call Vs Put OI to put simply) and secondly the active strikes.
Call vs Put OI can be free fetched from site named tradingtick.com at following link
https://tradingtick.com/options/callvsput
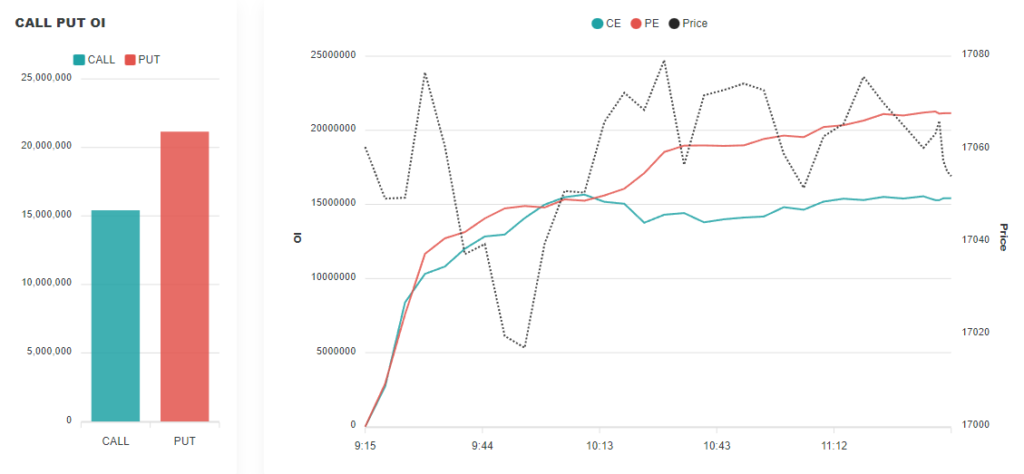
From the above data one can see the number of PE written ( PE written means PE sold which is bullish) is more than number of CE written so the trend is bullish based on data while writing this blog.
Identifying trend based on trending strikes
You can use below link to find the trending strikes
https://tradingtick.com/options/trending-oi-strike
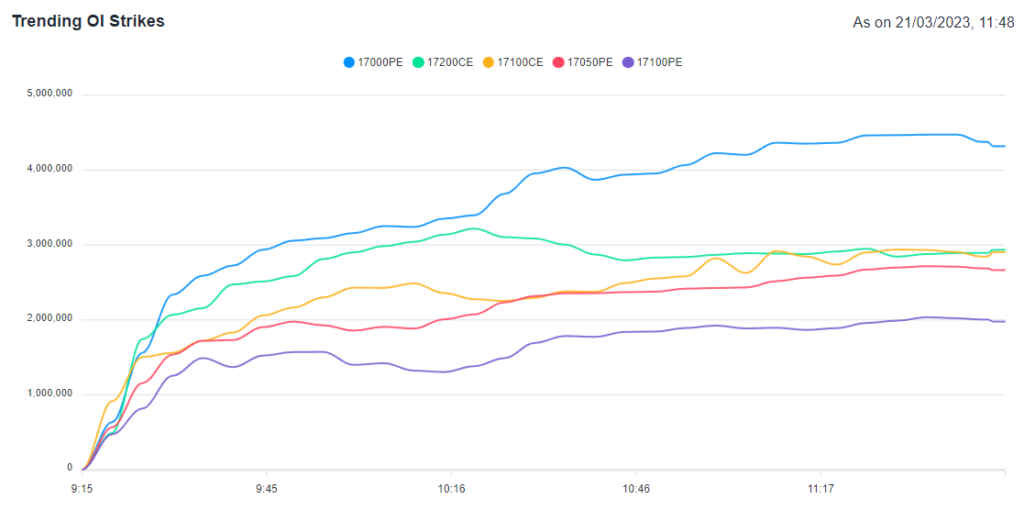
Now you can see that in trending strikes that highest OI is in 17000 PE around 42 lakhs and then remaining 2 PE which is 17050 and 17100 also have some PE writing so 3/5 trending OI strike prices are PE which also indicates a bullish bias.
Now that we know the trend is bullish it is time to chose bullish stocks and if the trend above had been bearish we would have searched for bearish stocks.
Searching the stock to trade
You can use the blow link to find the future OI (Open Interest i.e. number of open contracts)
https://tradingtick.com/futures/longshort
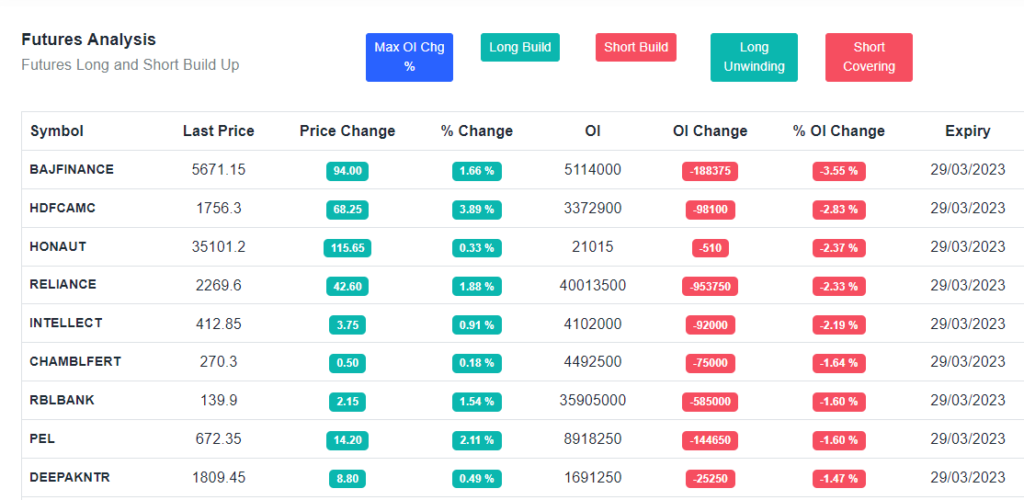
Now we know the trend is bullish, so instead of long buildup I prefer to chose the stocks that are seeing short covering the reason is the moves we get in short-covering stocks is faster than long build up.
Lets take Reliance in this case which was oversold and now seeing a short covering which means if the market trend continues it will continue to go up so this is one of the best stock to take intraday trade.
The similar pattern is seen in RBL Bank which is grossly oversold with many positive news flowing in the company.
For Deciding SL and Target a little knowledge of support and Resistance can be very helpful I will take an example and try to show you what SL and Target would look like in Reliance.
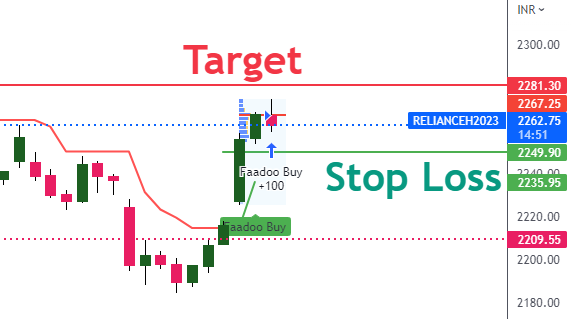
Based on hourly candle support for Reliance is at 2249 Target is around 2281 never use 5 mins to find support and resistance and if a 5 mins candle closes below 2249 then you should be smart enough to switch side from bullish to bearish, a intraday trader should always go with the flow.
Let me know if you have any queries or feedback on this.